How to Configure Metrics and Alarms in AWS CloudWatch for Serverless Architectures
Imagine you have a service that runs with a serverless architecture, you have several processes divided into lambdas that make up a Step Function and you need to monitor and know every time a particular lambda is invoked or fails, or a complete StateMachine fails. Well, if you have this need or something similar, this post is for you.
In this article you will learn the flow you should follow when you want to implement an alarm, and you will also see 2 examples and the small differences you can find in them. This way we will get to know CloudWatch and you will take advantage of its tools to effectively monitor your AWS resources.
Okay, but where do we start?
🧠 Step 1: Identifying our resource to monitor
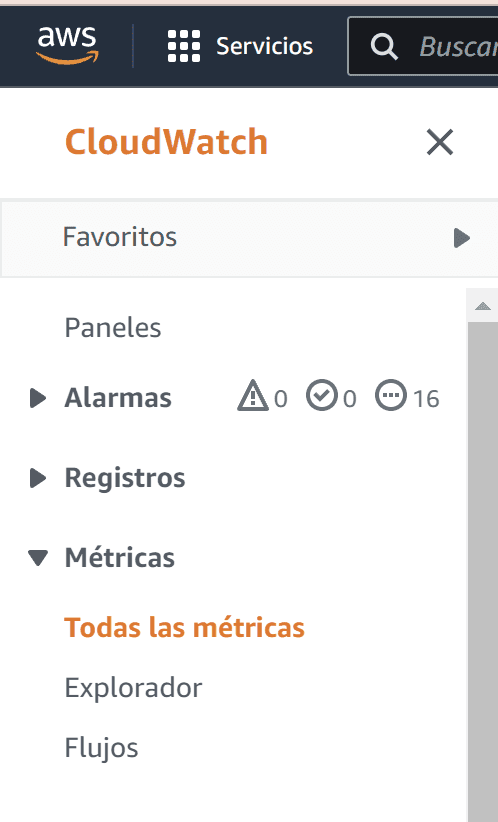
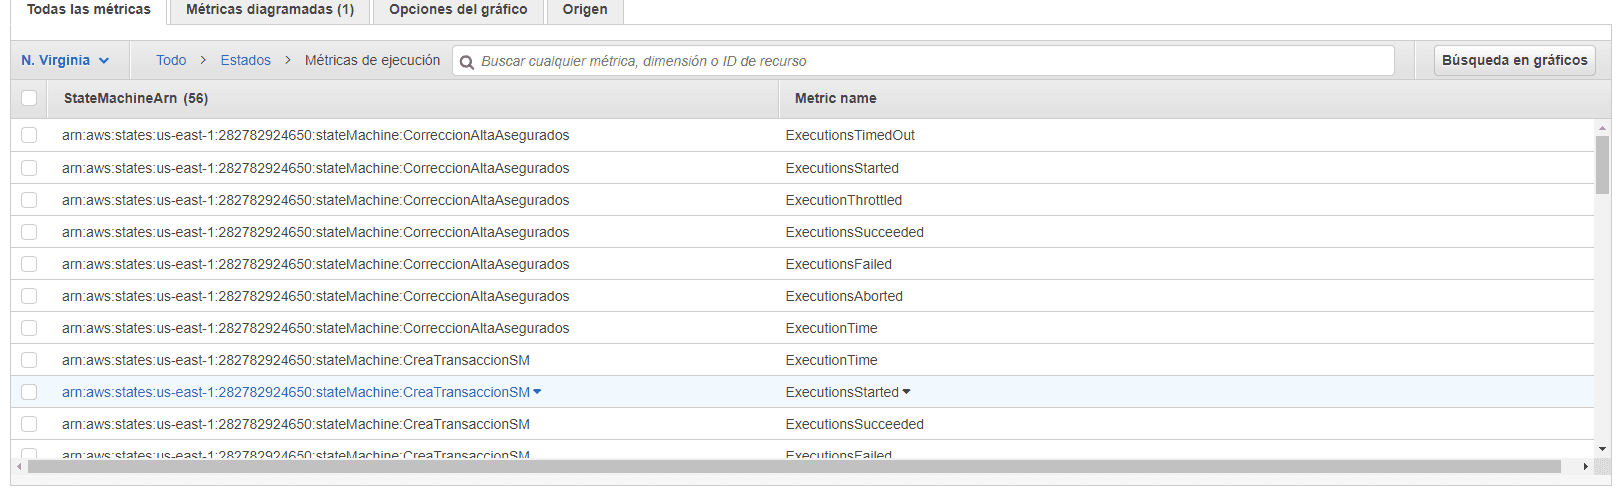
The first step is to navigate the sea of possibilities regarding metrics in CloudWatch, for that from the console we can go directly to CloudWatch, once there look in the panel for the Metrics, then to All metrics.
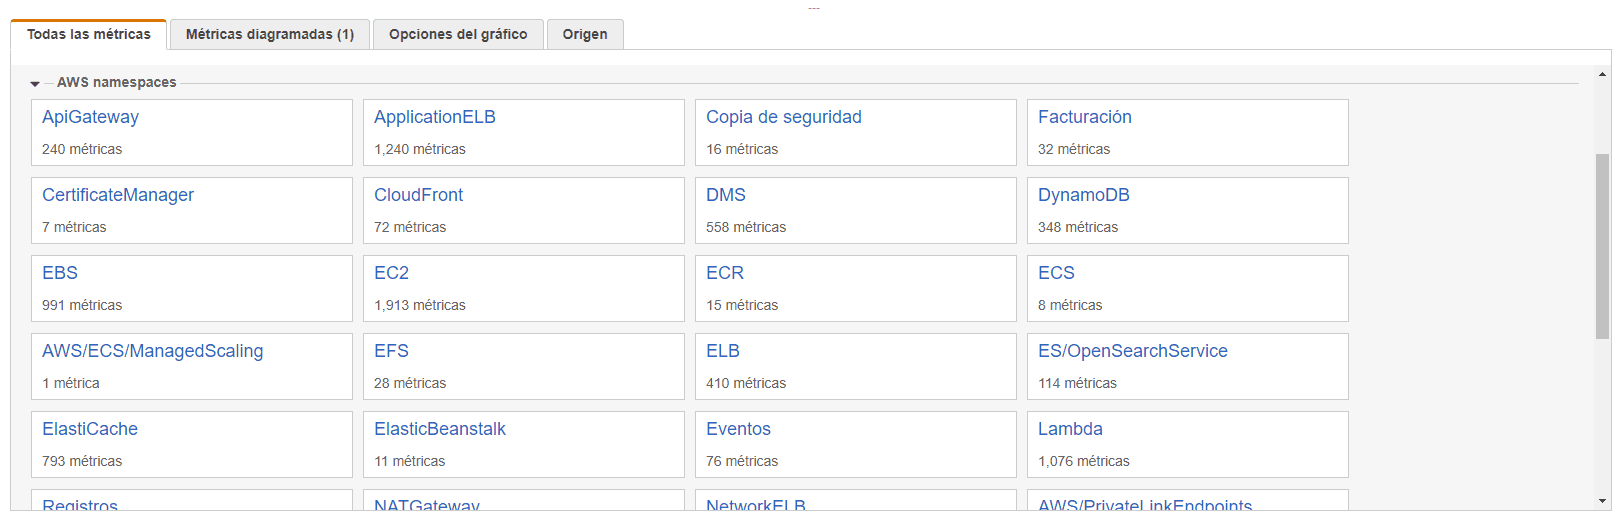
Okay now you may feel overwhelmed by the number of options, but to continue with the example we will look for a particular metric, although as you can see in the following image, practically any resource can be monitored, such as calls to an API in API Gateway, the capacity of a table in DynamoDB or the number of messages notified through SNS.
🧠 Step 2: Choosing the metrics
This time you will take two types of metrics, among the most common, with their options and you will see small differences that unfortunately are not specified in official AWS documentation.
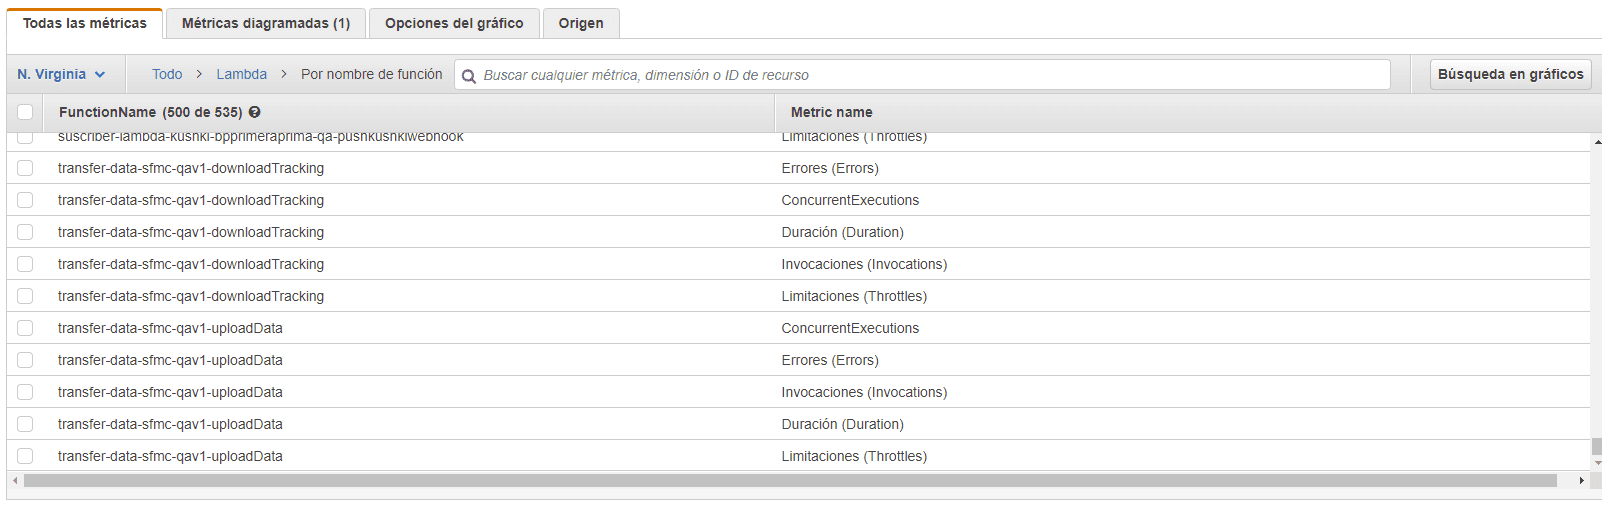
Look for a Lambda metric, and another State metric for a StateMachine.
Lambda Metric: Here you will see 3 options you can use, the most effective to monitor a single lambda is to use By function name. These are: Duration, Errors, Invocations, Throttles, ConcurrentExecutions and UnreservedConcurrentExecutions. We will use Invocations and Errors in this example.
State Metric: Just like with lambdas, state metrics can be defined in several ways, for this example you will use the Execution Metrics. These are: ExecutionsSucceeded, ExecutionsFailed, ExecutionsAborted, ExecutionThrottled, ExecutionsTimedOut, ExecutionsStarted and ExecutionTime. You will use ExecutionsFailed in this example.
💬 Important Data about the metrics:
Okay, I am going to clarify a couple of important data about the metrics.
Metrics can be created and monitored through a graph in the AWS console. Either by selecting it in Metrics/All metrics or by creating a custom panel/dashboard for one or more metrics. Yes. We will see examples of how to create panels to add your graphs and keep everything more tidy and organized.
However, there is another element of the metrics that we will use in this post, and those are alarms. These help us along with the SNS service, so we do not have to constantly check the graphs in the console but we can choose to receive an email when it fails or when a limit is exceeded on a certain resource.
🧠 Step 3: How a metric is defined
Okay, let's see how the metric is defined, according to the official documentation, we have many possible fields, some mandatory and others optional, you can see more here: https://docs.aws.amazon.com/es_es/AWSCloudFormation/latest/UserGuide/aws-properties-cw-alarm.html. But I will give you an example below:
This is an example of how two alarms would be defined for a Lambda, one that notifies every time the function is invoked and another every time it fails.
💡 This is an example of how two alarms would be defined for a Lambda, one that notifies every time the function is invoked and another every time it fails.
{
	"LambdaExampleInvocation": {
		"Type": "AWS::CloudWatch::Alarm",
		"Properties": {
			"AlarmName": "${self:custom.prefix}-lambdaExample-invocation",
			"AlarmDescription": "Invocation of a lambda is 0",
			"AlarmActions": [
				"${self:custom.stageVars.snsToAlarmNotification}"
			],
			"Namespace": "AWS/Lambda",
			"MetricName": "Invocations",
			"Statistic": "Sum",
			"Period": "3600",
			"Dimensions": [
				{
					"Name": "FunctionName",
					"Value": "${self:custom.prefix}-lambdaExample-${opt:stage}"
				}
			],
			"EvaluationPeriods": "1",
			"ComparisonOperator": "LessThanOrEqualToThreshold",
			"Threshold": "0"
		}
	},
	"LambdaExampleErrorRatio": {
		"Type": "AWS::CloudWatch::Alarm",
		"Properties": {
			"AlarmName": "${self:custom.prefix}-lambdaExample-errors",
			"AlarmDescription": "Error rate greater than 0",
			"AlarmActions": [
				"${self:custom.stageVars.snsToAlarmNotification}"
			],
			"Namespace": "AWS/Lambda",
			"MetricName": "Errors",
			"Statistic": "Sum",
			"Period": "3600",
			"Dimensions": [
				{
					"Name": "FunctionName",
					"Value": "${self:custom.prefix}-lambdaExample-${opt:stage}"
				}
			],
			"EvaluationPeriods": "1",
			"ComparisonOperator": "GreaterThanThreshold",
			"Threshold": "0"
		}
	}
}
💡 In this example an alarm is defined for a StateMachine which sends an email when it fails an execution.
{
    "StateMachineExecutionsFailed": {
      "Type": "AWS::CloudWatch::Alarm",
      "Properties": {
        "AlarmName": "StateMachine-Executions-Failed",
        "AlarmDescription": "StateMachine Failed in Stage: ${self:provider.stage}",
        "AlarmActions": [{ "Ref": "AlarmEmailNotificationSnsTopic" }],
        "Namespace": "AWS/States",
        "MetricName": "ExecutionsFailed",
        "Statistic": "Maximum",
        "Period": "60",
        "Dimensions": [
          {
            "Name": "StateMachineArn",
            "Value": "arn:aws:states:${self:provider.region}:${self:provider.arnStateMachine}:stateMachine:ExampleNameState"
          }
        ],
        "EvaluationPeriods": "1",
        "ComparisonOperator": "GreaterThanThreshold",
        "Threshold": "0",
        "Unit" : "Count"
      }
    }
}
💬 Small Differences
First, you must keep in mind that the metric name is what defines it as such, then there are fields that define in time and form how the metric will be displayed in the graph.
For example the Period field, in seconds, during which the statistic is applied. This is necessary for an alarm based on a metric. Valid values are 10, 30, 60 and any multiple of 60.
✅ To learn more about each field in the example: https://docs.aws.amazon.com/AWSCloudFormation/latest/UserGuide/aws-properties-cw-alarm.html
The Dimensions field is the one that defines the resource to which it is connected and how (by name or by arn).
So, this is the difference between defining a lambda and a StateMachine (the lambda is under the metric by name and the StateMachine under the metric by the state ARN).
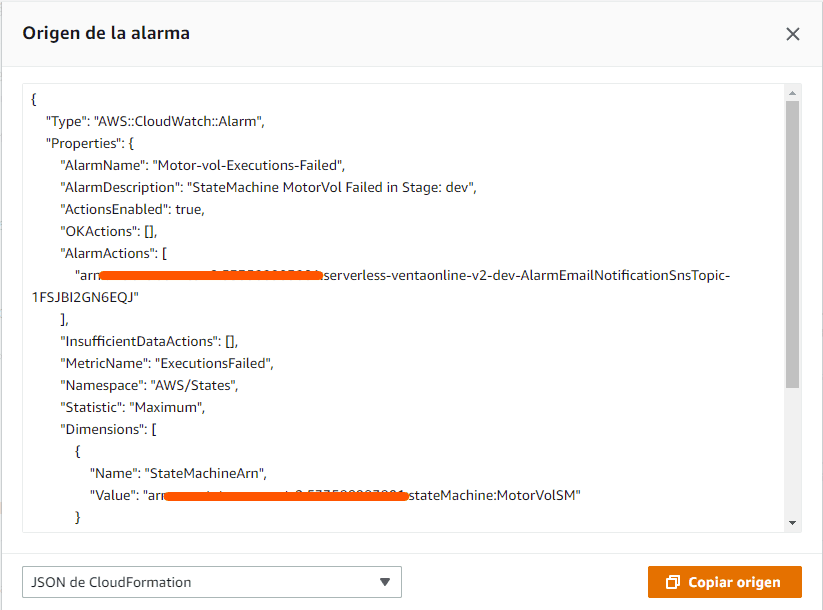
✅ About the name and value, it should be considered that when the alarm is defined by name, the Name you can give it your choice and the Value must be exactly the name of the resource, in this case the Lambda. However, in case of using arn as Value, the Name must be the name of the resource plus the arn, in this case it is StateMachineArn. This rule may vary, but if you want to be sure, create the alarm directly in the console as a test and go to Actions and press View source.
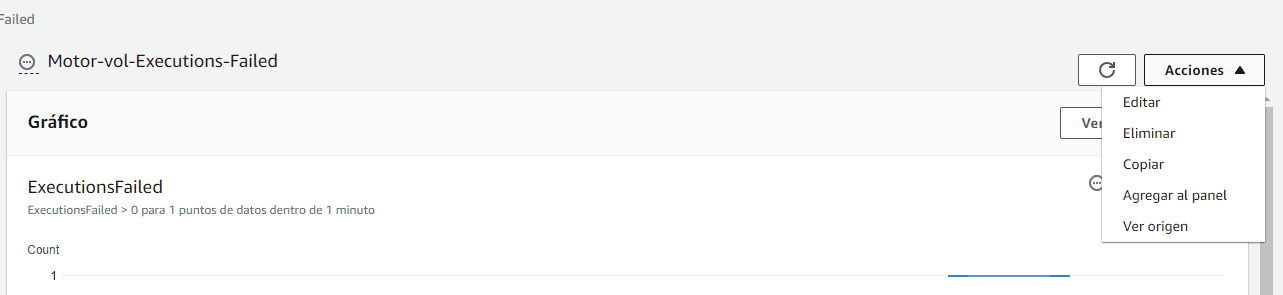
This technique is very useful when you do not know the service well or you are not sure how to define it. In this case that option opens a window like the following, where we can see the correct and automatic definition.
The AlarmActions field is the one that defines which service or action is executed when the metric condition is met (in this case an SNS is executed).
Second, the Dashboard has a way to be defined, generally in a dashboard.js and then a widget .json. In a Dashboard there can be n widgets, each reflecting a different alarm. Let's see an example:
#dashboard.js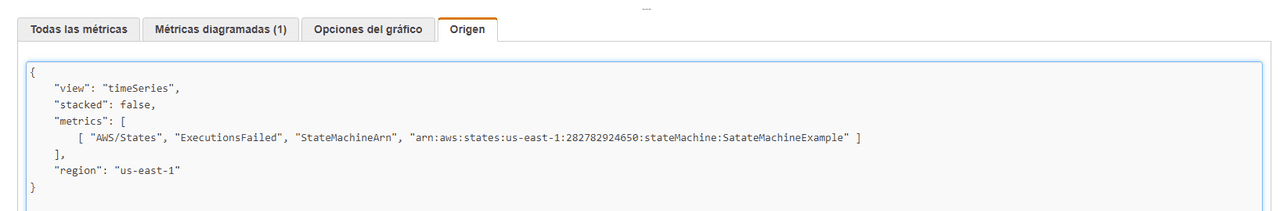
const StateMachine = require('./widgets/StateMachine.json');📌 Tip: You can see the metric information by selecting it on the panel and going to the Source tab.
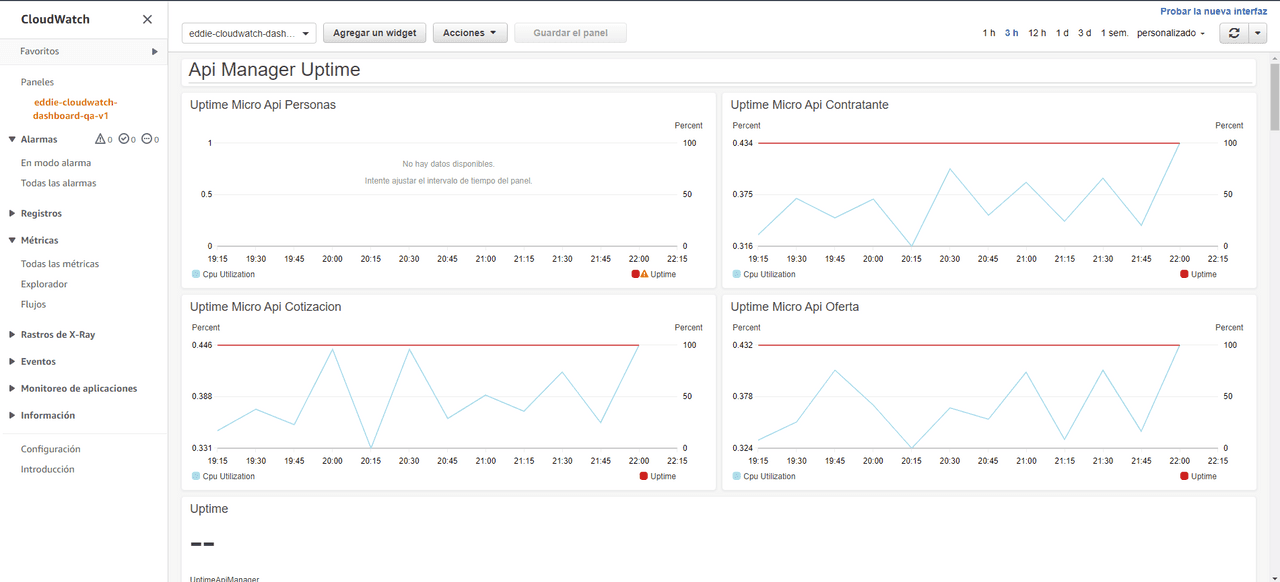
Dashboards are displayed as follows:
Perfect, now you know how to define and also which path to follow whenever you want to monitor a resource in AWS. But I know that all help is useful, so I prepared a repository with an example structure, where you can see how to reference in serverless.yml for example and how to handle environment variables like email or ARNs in different environments.
https://github.com/JazminTrujilloEyzaguirre/CloudWatch_ProjectExample
✅ Last tip: Alarms can be defined in the same project where you have your resources, for example your application, with your lambdas or your step functions, or you can also have a separate project just for alarms, since these are referenced by name or ARNs. This will give you order and help you avoid overloading your projects.
Finally, these alarms create and integrate the SNS service, which allows you to add emails where we will receive alarm notifications; for this, you must view them in the console.
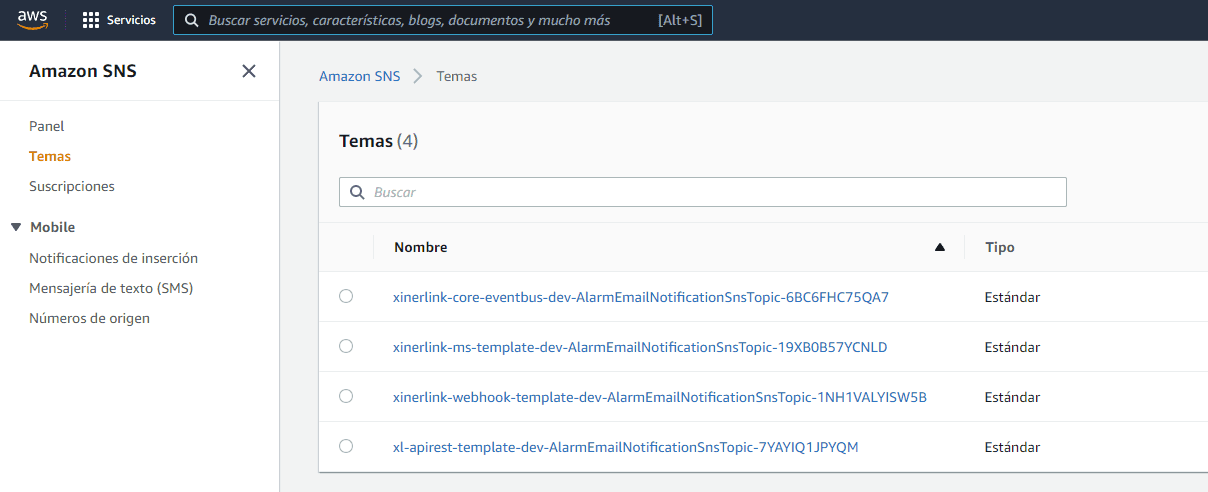
In Topics you can see all the topics that have been created.
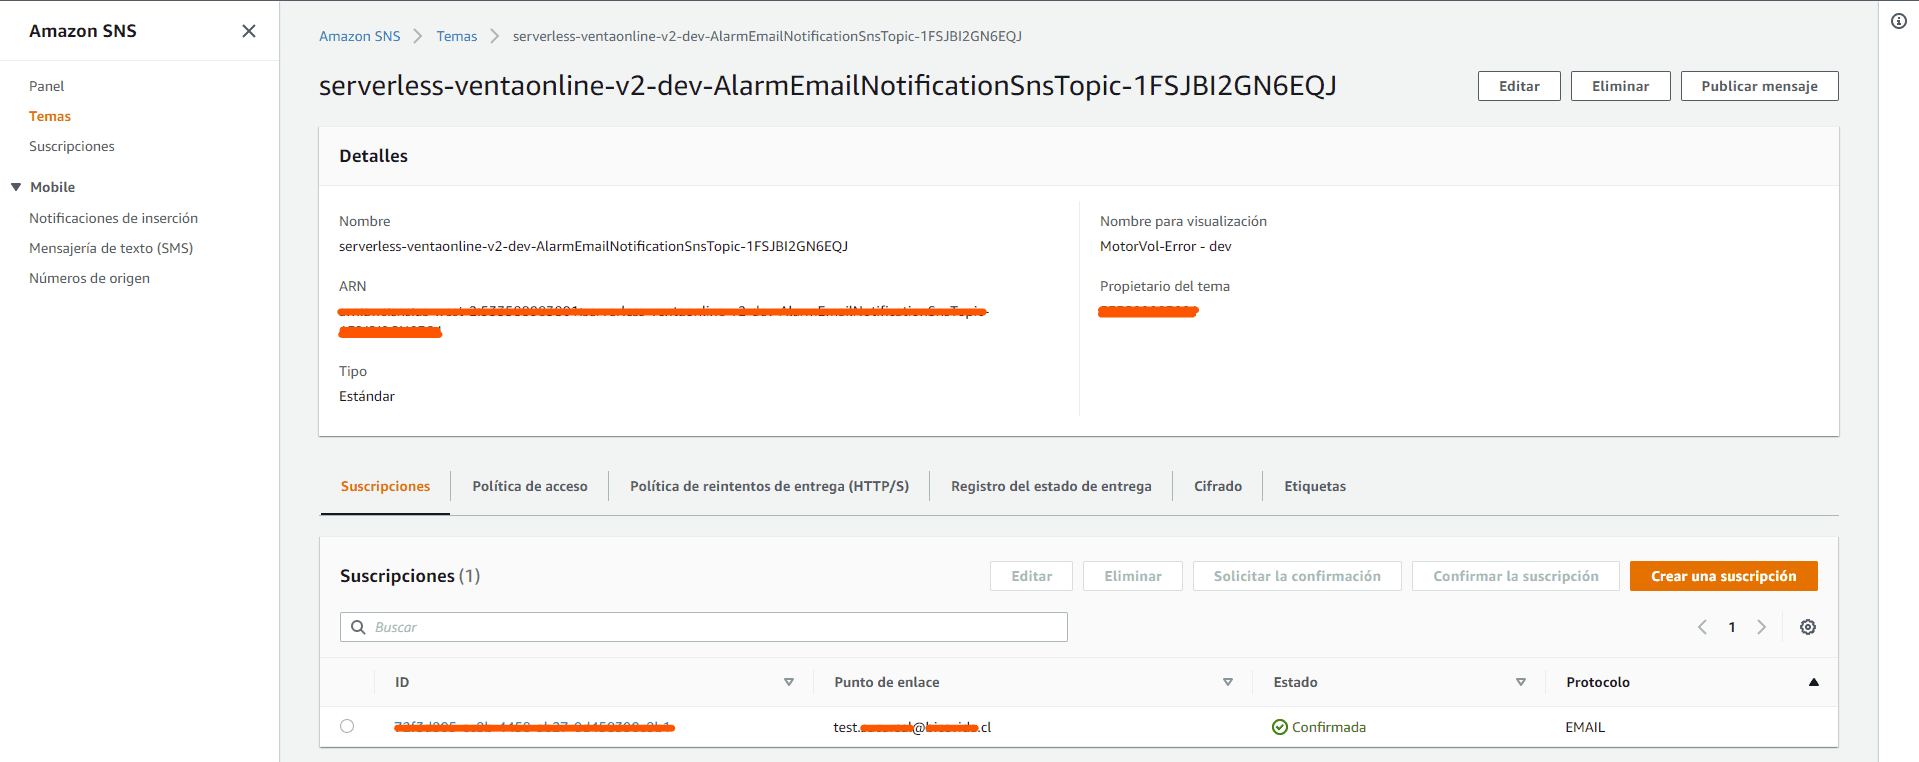
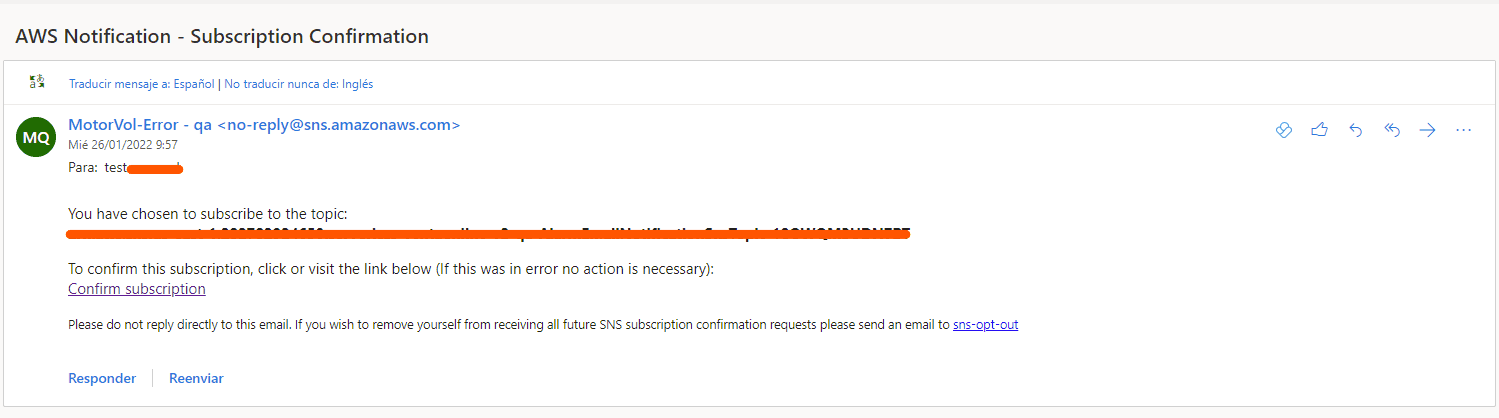
Once located, make sure the email you added is in the Subscriptions section. But to receive notifications you must subscribe from an email that will arrive similar to this:
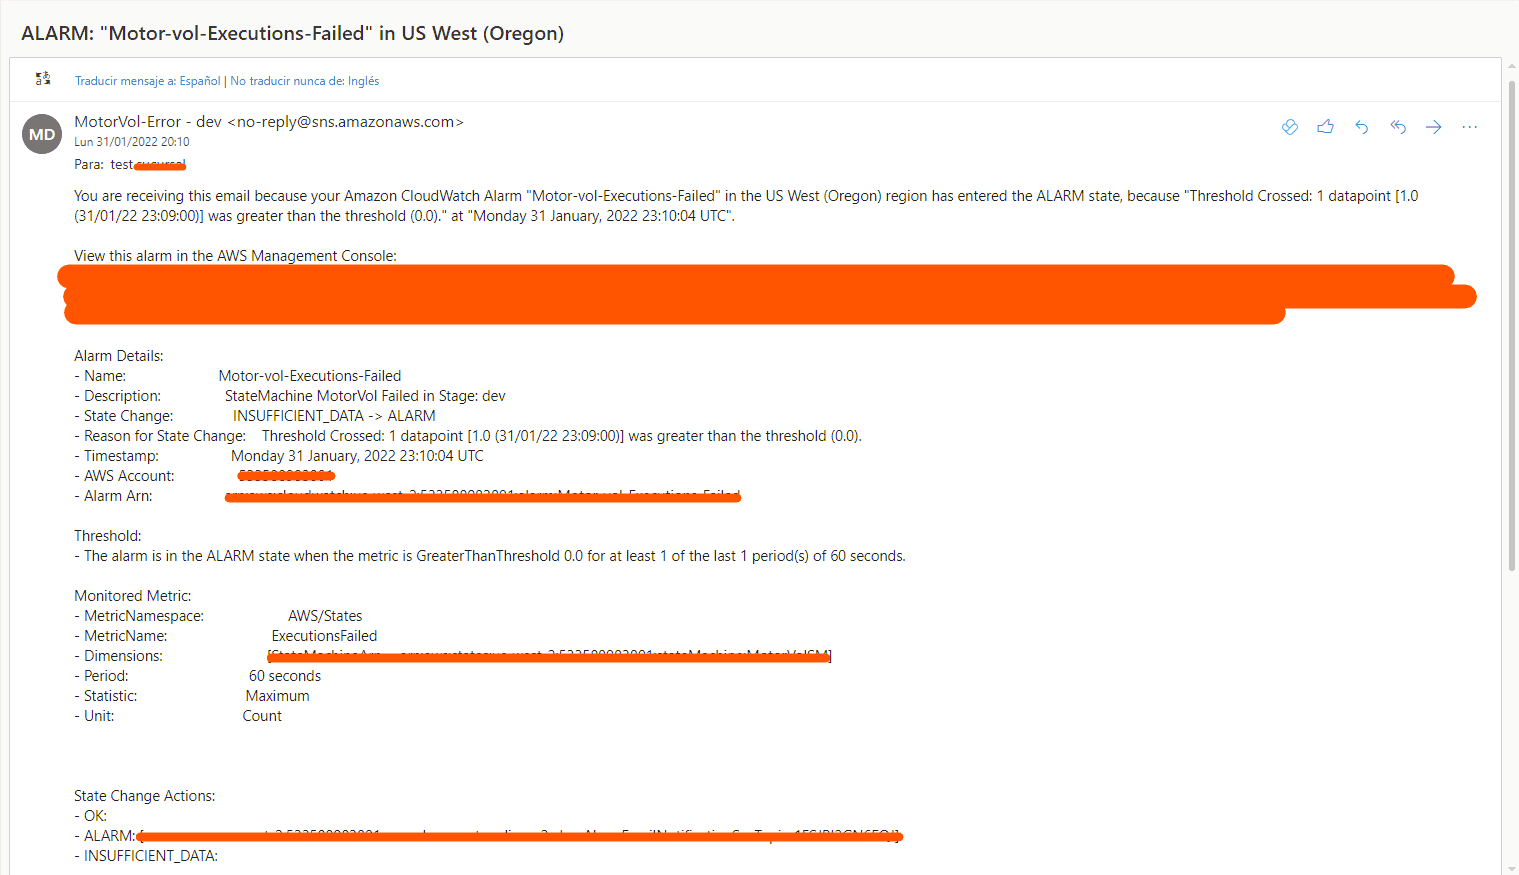
The notifications you should expect when your alarm activates will be like this:
Each resource handles metric alarms uniquely, although similar at first glance. I hope this example has helped you, that you know where to start if you have a particular need, but if you still have doubts... Write to us! We are eager to help you.
Ready to improve the observability of your serverless applications?
At Kranio, we have experts in monitoring and automation who will help you implement efficient solutions using AWS CloudWatch, optimizing your processes and ensuring your applications' performance. Contact us and discover how we can drive your company's digital transformation.
Previous Posts
AI Prompt Injection: How to Secure Your Infrastructure
Discover what Prompt Injection in AI is, how the latest attacks work, and what strategies to implement to protect agents, copilots, and LLM-based systems.
RabbitMQ (the king of queues) or Apache Kafka (the event streaming giant)?
Learn the differences between RabbitMQ and Apache Kafka, their use cases, and the 2026 updates to choose the best messaging solution for your architecture.